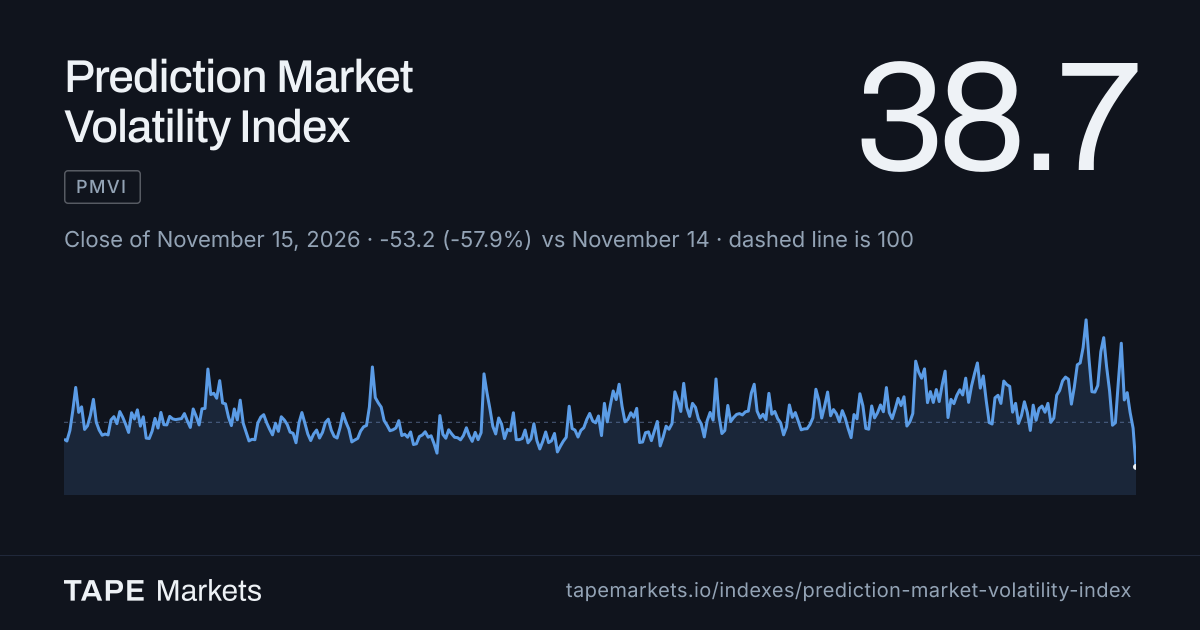
How much more than usual the odds on live event markets are swinging, from elections and wars to central banks.
Every day since July 1, 2024, 868 days in all. Most sit near 100. The spikes are the days the news changed what people expected.
On November 6, 2024 the odds on event markets moved 3.6 times as much as on a typical day. Day after the US presidential election.
The index reads only prices. Nothing in it knows about the news. The biggest days still line up with the moments that changed the outlook.
Every day's reading comes from the event markets that traded that day. Book a demo and we'll show you which ones drove any day you pick, and how the topics compare.
Everything the index is built from is in TAPE's data, and we'll walk you through it.
Which event markets swung the most on any day, and by how much against their own normal.
Politics, geopolitics and the economy, each on the same scale.
How the reading built through a day, from the same hourly prices.
What Polymarket's best-scored traders did on the loudest days.
No. It's a level. 100 is a typical day in 2025, so 200 means the odds moved about twice as much as usual.
Their odds swing because a game is being played or a coin's price is moving. That's expected, so it would drown out the days the world actually got less certain.
No. It reads only the odds and how much traded. No news, no opinions, no trader data.
Every day, once the day's prices are complete. The figures on this page run to November 15, 2026.
The index is a record of how much the odds moved and does not constitute advice. A high reading does not indicate the direction of any market. The index is not an investment product and cannot be bought, sold or traded. Its figures may be revised as underlying data is corrected.
Every index is on the indexes page and in the platform. See how research teams use them.
Book a demo and we'll show you the markets behind any day's reading.